

CurriculumCurrículoAIGrades 9 to 12Grados 9 a 12AI-HS-04
Data Science FoundationsFundamentos de ciencia de datos
Question a real dataset before you analyze it: where it came from and what is missing, then one honest chart and a finding stated with its limits.Interrogue un conjunto de datos real antes de analizarlo: de dónde viene y qué falta; luego, una gráfica honesta y un hallazgo expresado con sus límites.
- Ways in:Formas de empezar:
- Read, 1 minuteLeer, 1 minuto
- Do, 225 minutesHacer, 225 minutos
- Simulate, 10 minutesSimular, 10 minutos
- GradesGrados
- Grades 9 to 12, and any learner ready for itGrados 9 a 12, y cualquier persona lista para ello
- TimeTiempo
- 5 sessions of about 45 minutes5 sesiones de unos 45 minutos
- CostCosto
- Needs equipmentNecesita equipo
The MESH'D components this unit uses:Los componentes MESH'D que usa esta unidad:SoftwareSoftwareHolistic DesignDiseño integral
The driving questionLa pregunta central
What does the data admit when you question it?¿Qué admiten los datos cuando usted los interroga?
Learners work with real datasets in a cloud notebook, asking who collected the data and why before writing a single line of code. Every finding they state comes with its limits attached.Los estudiantes trabajan con conjuntos de datos reales en un cuaderno en la nube, y preguntan quién reunió los datos y por qué antes de escribir una sola línea de código. Cada hallazgo que expresan viene con sus límites.
Learners will be able toAl terminar se podrá
- Question a dataset's provenance before any analysis.Interrogar la procedencia de un conjunto de datos antes de cualquier análisis.
- Load, clean and summarize data with a data library, logging every cleaning decision.Cargar, limpiar y resumir datos con una biblioteca de datos, anotando cada decisión de limpieza.
- Make one honest chart.Hacer una gráfica honesta.
- State a finding together with its limits.Expresar un hallazgo junto con sus límites.
Words to knowPalabras para conocer
- provenanceprocedencia
- cleaninglimpieza de datos
- summary statisticsestadística descriptiva
- distributiondistribución
- honest axesejes honestos
- limitationlimitación
Where the math isDónde están las matemáticas
Statistics on real data: summary statistics, distributions, and honest axes and baselines on charts, with algebra-style reasoning used to analyze the numbers.Estadística con datos reales: estadística descriptiva, distribuciones, y ejes y líneas base honestos en las gráficas, con razonamiento algebraico para analizar los números.
Big ideas in AIGrandes ideas de la IA
- Learning: They can learn from data.Aprendizaje: Pueden aprender de los datos.
Session by sessionSesión por sesión
What to doQué hacer
- Fill out a dataset card: who collected the data, why, and what is missing. No code until the card is done.Complete una ficha del conjunto de datos: quién reunió los datos, para qué y qué falta. Nada de código hasta terminar la ficha.
- Learn the basics of a data library: load, clean and describe the data, logging every cleaning decision.Aprenda lo básico de una biblioteca de datos: cargar, limpiar y describir los datos, anotando cada decisión de limpieza.
- Make one honest chart, minding the axes and baselines, and pick apart a gallery of misleading charts by hand.Haga una gráfica honesta, cuidando los ejes y las líneas base, y analice a mano una galería de gráficas engañosas.
- Write up your finding with its limits, giving what the data cannot say a paragraph of its own.Escriba su hallazgo con sus límites, y dedique un párrafo propio a lo que los datos no pueden decir.
- Give a three-minute talk on your finding.Dé una charla de tres minutos sobre su hallazgo.
What you needLo que necesita
- printed dataset cardsfichas de conjuntos de datos impresas
- printed examples of misleading chartsejemplos impresos de gráficas engañosas
EquipmentEquipo
- a laptop or computeruna computadora portátil o de escritorio
- a cloud notebook with a data libraryun cuaderno en la nube con una biblioteca de datos
Needs equipment.Necesita equipo.
With no device at allSin ningún aparato
Analyze printed dataset cards and critique printed misleading charts, which carry the main ideas. The notebook work picks up when a device is available.Analice fichas impresas de conjuntos de datos y critique gráficas engañosas impresas, que llevan las ideas principales. El trabajo en el cuaderno continúa cuando haya un dispositivo.
An adult chooses and checks the datasets, and nothing in them identifies a person. An adult sets up the cloud notebook and supervises the work, and agents and tools that can act are always supervised.Un adulto elige y revisa los conjuntos de datos, y nada en ellos identifica a una persona. Un adulto prepara el cuaderno en la nube y supervisa el trabajo, y los agentes y las herramientas que pueden actuar siempre se supervisan.
What learners make and showLo que se hace y se muestra
A finding from one notebook, presented in three minutes. A strong talk shows documented cleaning, an honest chart, and a stated limit that costs the presenter something.Un hallazgo de un solo cuaderno, presentado en tres minutos. Una buena charla muestra la limpieza documentada, una gráfica honesta y un límite reconocido que le cuesta algo a quien presenta.
Mix-ups to expectConfusiones que esperar
- Correlation is the story. Two things moving together does not show that one causes the other.La correlación es la historia. Que dos cosas cambien juntas no demuestra que una cause la otra.
- Cleaning data is cheating. Undocumented cleaning is cheating; cleaning you log and can explain is honest work.Limpiar los datos es hacer trampa. La limpieza sin documentar es trampa; la limpieza que se anota y se puede explicar es trabajo honesto.
- The chart speaks for itself. Every chart is an argument, and its axes and baselines can make the same data say different things.La gráfica habla por sí sola. Toda gráfica es un argumento, y sus ejes y líneas base pueden hacer que los mismos datos digan cosas distintas.
At homeEn casa
Try it at the kitchen tablePruébelo en la mesa de la cocina
Play spot the trick with your family: collect charts from ads or the news and take turns saying what each chart is doing to make you believe something.Juegue a descubrir el truco con su familia: reúnan gráficas de anuncios o de las noticias y túrnense para decir qué hace cada gráfica para convencerlos de algo.
Simulate, 10 minutesSimular, 10 minutos
Roll the dice: what chance looks likeTire los dados: cómo se ve la probabilidad
Roll one die or two, once, ten times or a thousand, and watch your tally settle onto the shape that chance predicts.Tire uno o dos dados, una vez, diez veces o mil, y vea cómo su conteo se acomoda a la forma que predice la probabilidad.
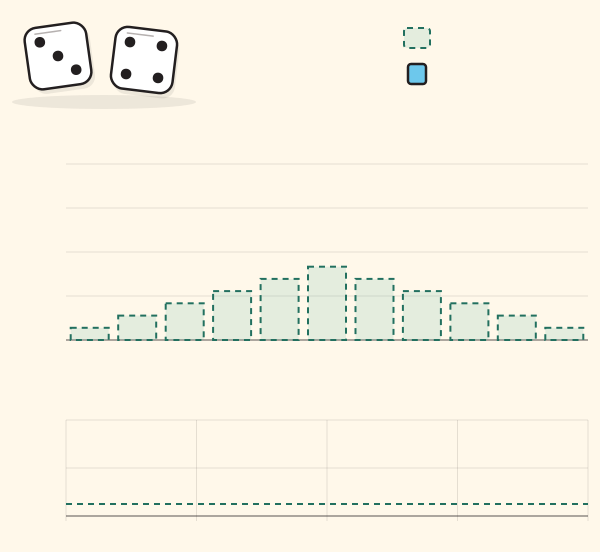
The drawing shows where it starts. It runs here once its script has loaded.El dibujo muestra dónde empieza. Funciona aquí una vez que carga su código.
Your challengeSu reto
- Roll ten times and compare the bars with the green boxes.Tire diez veces y compare las barras con las cajas verdes. Not done yet.Todavía no.
- Roll two dice at least a hundred times. Which sum comes up most?Tire dos dados al menos cien veces. ¿Qué suma sale más? Not done yet.Todavía no.
- Roll until the bars are off from the expected shape by less than five percent.Tire hasta que las barras estén a menos del cinco por ciento de la forma esperada. Not done yet.Todavía no.
- With one die, find a run of ten rolls with no six at all.Con un dado, encuentre una serie de diez tiradas sin ningún seis. Not done yet.Todavía no.
Every challenge done. Now try it for real at home.Todos los retos logrados. Ahora pruébelo de verdad en casa.
Last rollÚltima tirada
Comes up most so farLa que más ha salido
Off from the expected shapeLejos de la forma esperada
Run numberNúmero de serie
A green dashed box is the expected shape: how tall each bar would be if every result came up exactly as often as its chance says. A blue bar is your rolls, as a share of all of them. The red line is how far off the bars are: the share of rolls that would have to move to another bar to match the green boxes.Una caja verde punteada es la forma esperada: qué tan alta sería cada barra si cada resultado saliera exactamente tan seguido como dice su probabilidad. Una barra azul son sus tiradas, como parte del total. La línea roja es qué tan lejos están las barras: la parte de las tiradas que tendría que pasar a otra barra para igualar las cajas verdes.
What is happeningQué está pasando
A fair die gives each face the same chance: one in six. If you could roll forever, each face would come up on one roll out of every six, and the tally would be flat.Un dado justo le da a cada cara la misma probabilidad: una entre seis. Si pudiera tirar para siempre, cada cara saldría en una de cada seis tiradas, y el conteo sería plano.
Two dice are different. They can land in thirty-six ways. Six of those ways add up to seven (one and six, two and five, three and four, and each of those turned around), but only one way makes two and only one makes twelve. So the expected shape is a triangle with seven at the top.Dos dados son distintos. Pueden caer de treinta y seis maneras. Seis de esas maneras suman siete (uno y seis, dos y cinco, tres y cuatro, y cada una al revés), pero solo una da dos y solo una da doce. Por eso la forma esperada es un triángulo con el siete arriba.
A few rolls almost never look like the expected shape: luck decides a lot. As the rolls pile up, each bar’s share of all the rolls comes closer and closer to its chance. That is the law of large numbers. The counts keep wandering, but as a share of more and more rolls, the wandering matters less and less.Unas pocas tiradas casi nunca se parecen a la forma esperada: la suerte decide mucho. Al juntarse las tiradas, la parte de cada barra se acerca más y más a su probabilidad. Esa es la ley de los grandes números. Los conteos siguen variando, pero como parte de cada vez más tiradas, esa variación importa cada vez menos.
How far off the bars are is measured as the share of rolls that would have to move to another bar for the bars to match the expected shape exactly. Ten rolls are usually far off. A thousand rolls are usually off by only a few percent.Qué tan lejos están las barras se mide como la parte de las tiradas que tendría que pasar a otra barra para que las barras igualen exactamente la forma esperada. Diez tiradas suelen estar muy lejos. Mil tiradas suelen estar a solo unos pocos por ciento.
Things to tryCosas para probar
- Roll two dice ten times, then try another run and roll ten again. Do the two runs look alike? Now do the same with a thousand rolls.Tire dos dados diez veces, luego pruebe otra serie y tire diez más. ¿Se parecen las dos series? Ahora haga lo mismo con mil tiradas.
- Slide the rolls from one all the way to ten thousand and watch the red line fall.Deslice las tiradas desde una hasta diez mil y observe cómo baja la línea roja.
- At the same number of rolls, switch between one die and two dice and compare the shapes.Con el mismo número de tiradas, cambie entre un dado y dos dados y compare las formas.
- Roll two real dice thirty-six times at home and tally the sums. How close did you come to the triangle?Tire dos dados de verdad treinta y seis veces en casa y cuente las sumas. ¿Qué tanto se acercó al triángulo?
This is a model. The rolls come from a computer recipe that only looks random, and each run always gives the same rolls. Real dice are a little uneven and real throws are messy, but with fair dice you should see the same shapes.Este es un modelo. Las tiradas vienen de una receta de computadora que solo parece al azar, y cada serie siempre da las mismas tiradas. Los dados reales son un poco disparejos y los tiros reales son desordenados, pero con dados justos debería ver las mismas formas.
Open the simulation on its own pageAbrir la simulación en su propia página
Use it, share it, adapt itÚsela, compártala, adáptela
The credit to copyEl crédito para copiar
Free BYRD, CC BY. “Data Science Foundations” from the Byrd Academy STEM Curriculum by Byrd EDU, byrdathome.org.Free BYRD, CC BY. “Fundamentos de ciencia de datos”, del Currículo STEM de Byrd Academy, de Byrd EDU, byrdathome.org.
This is free to use, share and adapt, even commercially, under the Creative Commons Attribution 4.0 International license (CC BY 4.0), with this credit. What Free BYRD means.Esto es libre de usar, compartir y adaptar, incluso con fines comerciales, bajo la licencia Creative Commons Atribución 4.0 Internacional (CC BY 4.0), con este crédito. Qué significa Free BYRD.